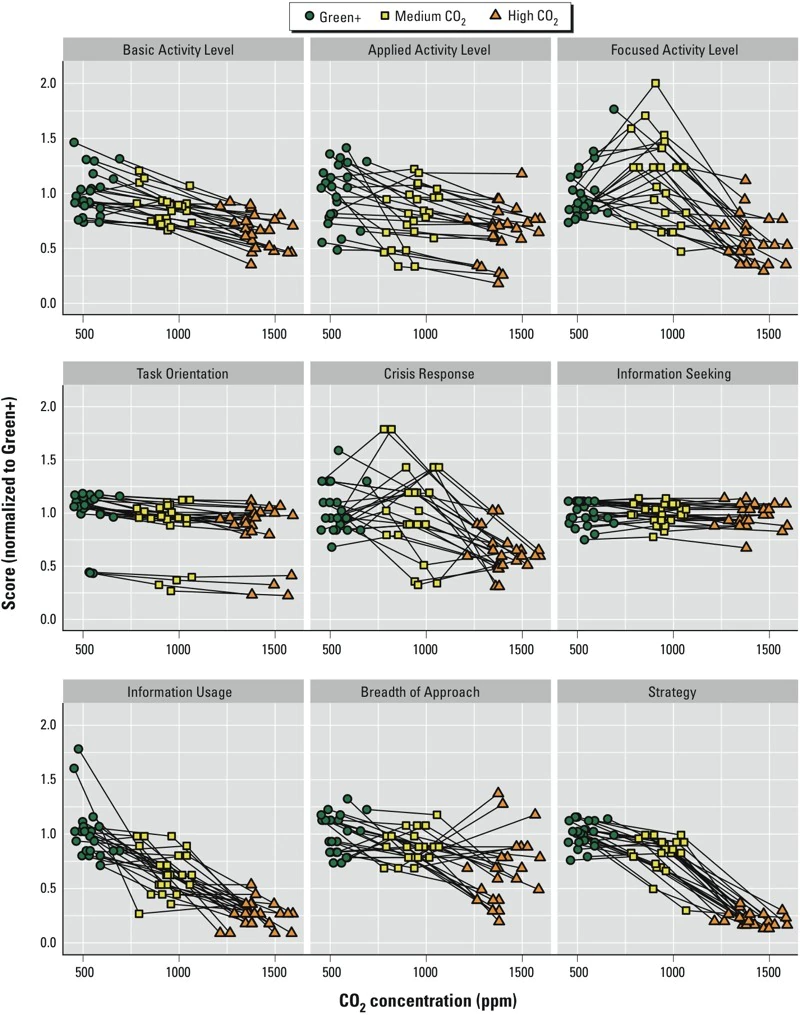
出典:Associations of Cognitive Function Scores with Carbon Dioxide,
Ventilation, and Volatile Organic Compound Exposures in Office Workers:
A Controlled Exposure Study of Green and Conventional Office
Environments | Environmental Health Perspectives | Vol. 124, No. 6
https://ehp.niehs.nih.gov/doi/10.1289/ehp.1510037#pane-pcw-references
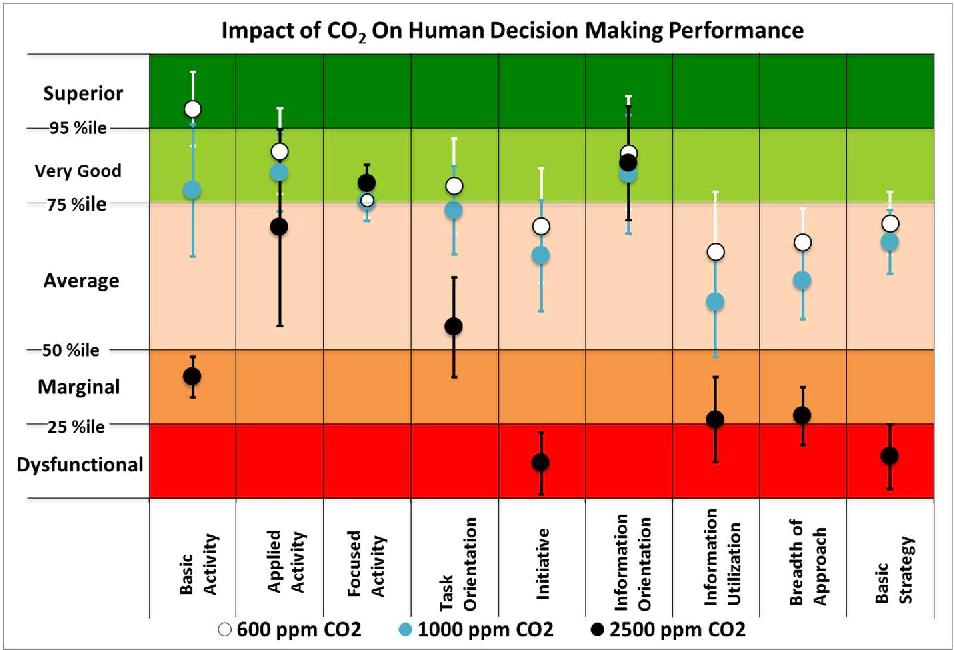
出典:Is CO2 an Indoor Pollutant? Direct Effects of Low-to-Moderate
CO2 Concentrations on Human Decision-Making Performance
https://www.semanticscholar.org/paper/Is-CO2-an-Indoor-Pollutant-Direct-Effects-of-CO2-on-Satish-Mendell/309e7ebea6e880cd2393bc38596933813022d335
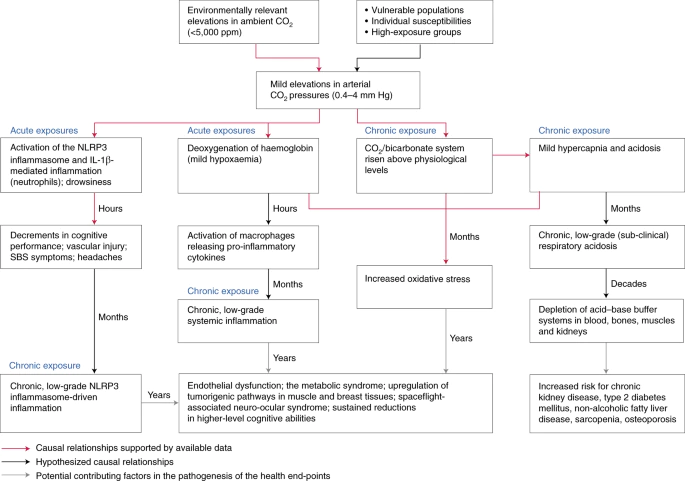
出典:Direct human health risks of increased atmospheric carbon
dioxide | Nature Sustainability
https://www.nature.com/articles/s41893-019-0323-1
# Licensed under CC0: https://creativecommons.org/publicdomain/zero/1.0/deed.en from numpy.typing import ArrayLike import numpy as np import matplotlib.pyplot as plt import matplotx.styles from pandas import Series, Timedelta, TimedeltaIndex import pandas as pd
plt.style.use(matplotx.styles.dracula)
defcalc_k(k_o: float, m: float, q: float, v: float, t: ArrayLike) -> ArrayLike: """Calculate the concentration of a fluid in a room. Parameters ---------- k_o : float Concentration of the fluid in the outside air. m : float Generation rate of the fluid. q : float Ventilation rate of the room. v : float Volume of the room. t : ArrayLike Time. Returns ------- ArrayLike Concentration of the fluid in the room at time t. """ if q == 0: return k_o + m / v * t elif q < 0: raise ValueError("q must be positive.") return k_o + m / q * ( 1 - np.exp(-q / v * t) )
defcalc_k_fin(k_o: float, m: float, q: float) -> float: """Calculate the concentration of a fluid in a room. Parameters ---------- k_o : float Concentration of the fluid in the outside air. m : float Generation rate of the fluid. q : float Ventilation rate of the room. Returns ------- float Concentration of the fluid in the room at time t=np.inf. """ if q == 0: return np.inf elif q < 0: raise ValueError("q must be positive.") return k_o + m / q
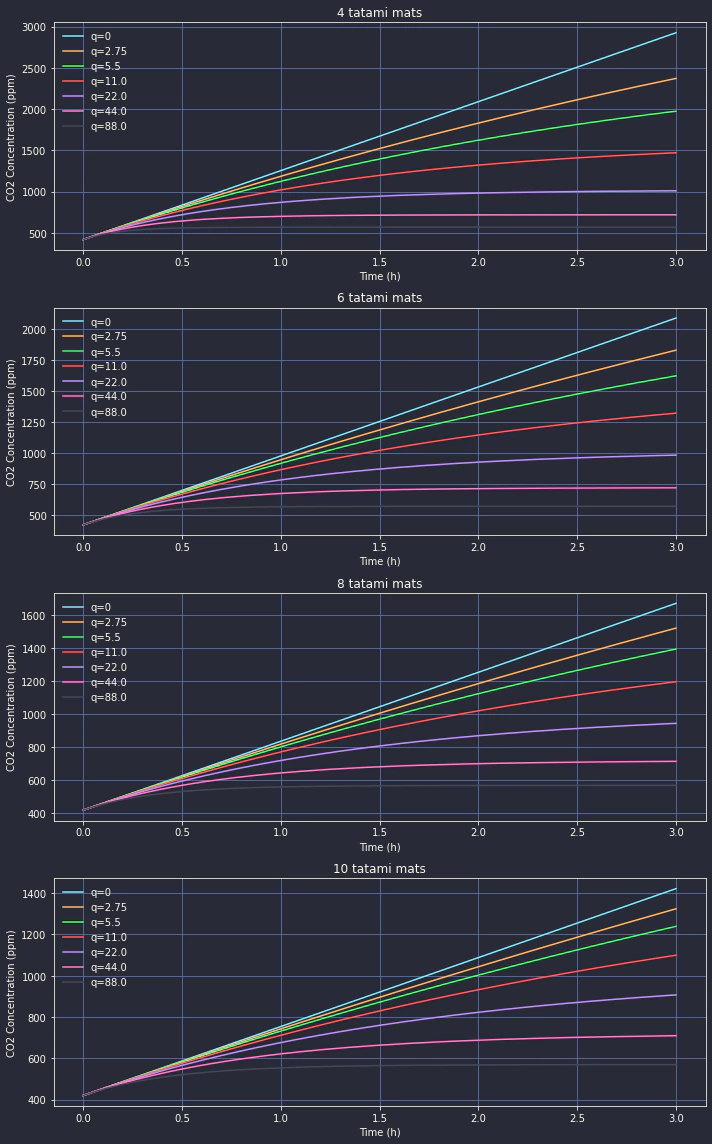
k_o = 420e-6 m = 0.0132# per hour ns = [4, 6, 8, 10]
# plot change in concentration over time t = np.linspace(0, 3, 480) qs = [0] + (22 * (2. ** np.arange(-3, 3))).tolist() fig, axes = plt.subplots(len(ns), 1, figsize=(10, 16)) for n, ax inzip(ns, axes): ax.set_title(f"{n} tatami mats") ax.set_ylabel("CO2 Concentration (ppm)") ax.set_xlabel("Time (h)") v = n * 1.62 * 2.44 for q in qs: k = calc_k(k_o, m, q, v, t) k = Series(k, t) * 1e6 k.plot(label=f"q={q}", legend=True, ax=ax, grid=True) fig.tight_layout()
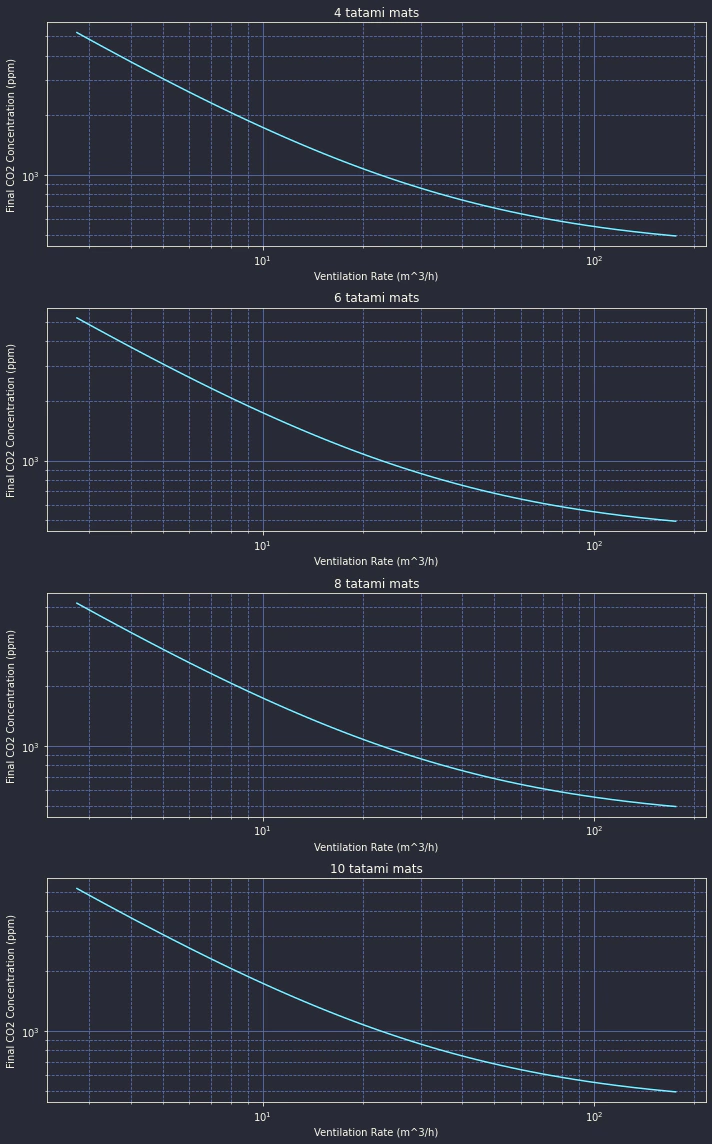
# plot final concentration vs ventilation rate fig, axes = plt.subplots(len(ns), 1, figsize=(10, 16)) qs = 22 * (2. ** np.linspace(-3, 3, 100)) for n, ax inzip(ns, axes): ax.set_title(f"{n} tatami mats") ax.set_ylabel("Final CO2 Concentration (ppm)") ax.set_xlabel("Ventilation Rate (m^3/h)") ax.grid(visible=True, which="major", axis="both") ax.grid(visible=True, which="minor", axis="both", linestyle="--") Series([calc_k_fin(k_o, m, q) * 1e6for q in qs], qs).plot(ax=ax, grid=True, logx=True, logy=True) fig.tight_layout()